
Electronic english version since 2022 |
The newspaper was founded in November 1957
| |
In JINR departments
About JINR detectors - in a reliable,
comprehensible and illustrative way
"Map of detector technologies" - a new information resource at JINR.
The Institute has accumulated a wealth of experience in implementing projects for the development and use of detector systems, sample environment systems, data registration and processing," Project Leader, Head of the Department of Innovation and Intellectual Property (DI&IP) Igor Lensky says. "In addition, we have gained experience of cooperation with manufacturers of components and materials, non-standard equipment and are in touch with scientific and technological partners that have the required competencies in development of detector technologies. In order to inventory and systematize information about such experience and infrastructure, to provide the possibility of contextual search of relevant information about technologies, competences and equipment applied at the Institute, development of this resource was initiated".
The desire to establish such a knowledge base was expressed many times. Detector specialists said that sometimes, in different departments, employees work with detectors of the same type, yet they do not know about each other, so they cannot share experience or information about suppliers, materials, others. There was interest on the part of DI&IP to have a kind of handbook, compiled by specialists, on the Institute's capabilities in this area. The representatives of Directorate expressed the wish that Partner Countries also see their participation in this technological domain.
The work on the application started more than a year ago. The members of the Association of Young Scientists and Specialists, the employees of the Laboratory of Information Technologies were involved in the work and later, the representatives of the relevant scientific groups joined in.
Weekly, we discussed the prototype of use, overview, architecture and principles of updating the system," MLIT junior researcher Anna Ilina says. "It turned out that there was no database in this area at the Institute. It was necessary to find specialists in Laboratories that would have the information needed. At present, when the application is almost ready, we can say that dozens of JINR employees, whom we call editors, took part in database updating, they provided data on all detectors, technologies, production, detector materials that are developed or used in JINR".
MLIT researcher Igor Pelevanyuk proposed a data storage format in the form of a graph database. "The choice of this approach was driven by the need to structure and visualize the accumulated data with a focus on the links between detectors, technologies, competencies and equipment," he commented.
After that, the work with the storage system, fields, information cells, programme implementation of the application, as well as database updating and editing started. The application is currently available at http://detectors.jinr.ru for those that have registration in the Single Sign-On (SSO) system. Access rights for editing are granted to employees authorized to work with such data from laboratories and departments of the Institute.
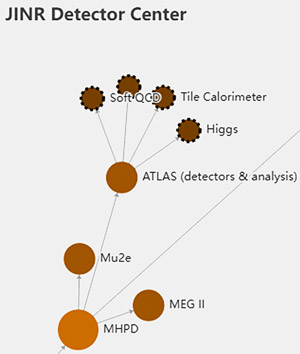
The main page of the application is a graph - a mathematical structure consisting of nodes and edges that connect to each other (Figure 1). Each node in the graph represents an object: laboratory, project, detector, others.

Figure 1
Any of the branches of the graph ends with a "gear" (if it is not, it means that the branch is still under development). These are nodes that contain detailed information about technologies. Double-clicking on this "gear" opens a window with a description of the technology. At some point, the application developers agreed that "to describe the technology" means to tell what the detector was constructed from (table "Components and Materials"), what operations had to be mastered to construct it ("Competencies") and what equipment these operations were performed on ("Equipment").
 |
| Figure 2 |
Thus, in general, the map shows the JINR groups dealing with detectors and their place in the organizational structure of the Institute, as well as the responsible persons who one can address to for additional information. On the other hand, on the periphery of this map, in the "gears" one can find out details about a particular detector.
At present, the search (Search button in the upper right corner on the home page) works for fields. In the field "Type", one can click to select a laboratory, project, or detector. Other fields, such as "Components", "Responsible" and others will display relevant information. The general table below summarizes all search results.
A filter system is provided to refine the search. In addition, all objects are tagged with corresponding tags. If you select the nodes of interest in the search table and press the Highlight selected nodes button, you can see this object on the graph, it is highlighted in yellow. And by using appropriate filters, one can see the place of the detector in the JINR structure and its relation with other detectors.
The developers' future plans include testing the search system and making detailed instructions on how to use the resource (currently, the main page has a "Memo", but it is rather intended for editors), as well as adding a semantic search based on the semantic meaning of the requested phrases. In addition, there are tags to be put in place that are linked to Partner Countries. In the ideal case, in the search results, a picture of all the capabilities - both detectors developed in the Institute and those that have our partners in scientific activities should appear by description or keywords. In other words, we should have a tool for scheduling extensive research in JINR and in other scientific centres.
The app provides two other interesting features. The first one is to view the sequence of how the Detector Technologies Map was constructed. By clicking the button "History", one can watch the process of "increase" of the graph, new nodes becoming available and data loading, as in an accelerated video. The second option is the button "View" that shows the whole database in the form of a summary table.
Last year, Igor Pelevanyuk and Anna Ilina received a certificate of state registration of the programme for visualization and accounting of technologies and competencies of the organization. As stated in the certificate, the programme allows entering information about activities, projects and specific facilities, taking into account their relations with each other. As a result, the visualized graph shows an overall picture of the technologies possessed by the organization. The programme is currently used to create the next resource, the Accelerator Technology Maps. These resources are made primarily for the convenience of JINR specialists but in time it will also become a tool for efficient cooperation with external partners.
Galina MYALKOVSKAYA